Solution focus
Newton's suite of income strategies seek to achieve income distributions and long-term capital growth. The philosophy behind the solutions in that the compounding of dividends is the dominant source of long-term real returns.

There are several reasons why we believe that income stocks could be an attractive option for investors:
1
Income prospects look attractive versus other income alternatives. Dividends may provide better inflation protection, and they are often more sustainable owing to many companies lowering payout ratios.
2
The potential for slower growth and lower capital returns from equity markets could make the income component of overall returns more significant.
3
Income stocks can provide diversification to any portfolio. Amid the global recovery from the pandemic, they have demonstrated an ability to decouple from growth stocks, tended to when the latter have come under pressure.
Value-orientated companies paying good dividend yields act differently to the rest of the market in a more inflationary environment
Newton’s equity income team expects earnings and dividend growth to remain relatively healthy in companies with safe balance sheets and low payout ratios – those with a track record of successfully adapting to a changing world. These are often well-known brand names that have successfully transitioned over time, including through world wars, inflation and deflation.
Newton believes dividends look more sustainable today than in previous market downturns. This is because during the pandemic companies reduced payout ratios. Distributing a lower percentage of earnings to shareholders means dividend coverage looks high, creating a buffer.
Dividends matter more in markets with higher inflation, volatility and lower returns. Income stocks have traditionally performed better relative to the broader equity market during periods of higher inflation, says James Lydotes, Deputy CIO and Head of Equity Income.
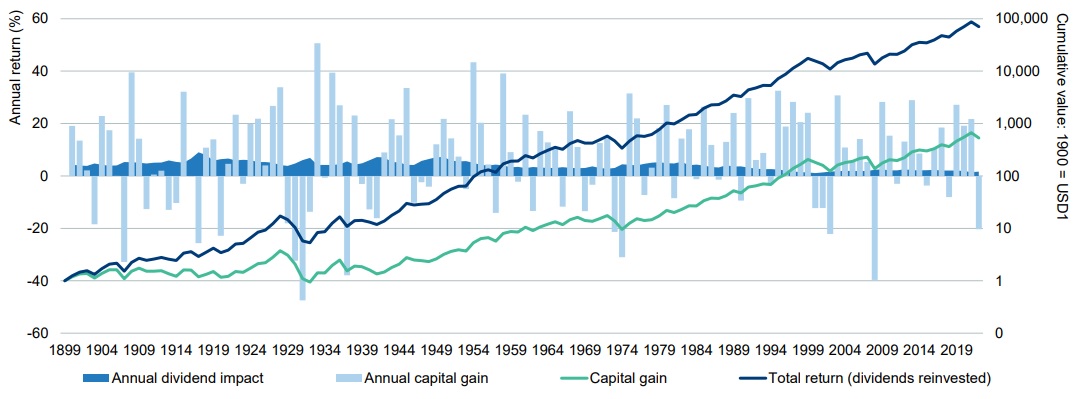
For illustrative purposes only.
Note: 1 Bespoke US stock index. Returns and capital gains 1900-2022.
Source: DMS Database, copyright © Elroy Dimson, Paul Marsh and Mike Staunton. Returns data licensed by Morningstar, 2022.
Newton offers a range of income solutions to meet investors’ unique mix of yield / risk appetite.
The value of investments can fall. Investors may not get back the amount invested. Income from investments may vary and is not guaranteed.
Past performance is not a guide to future performance.
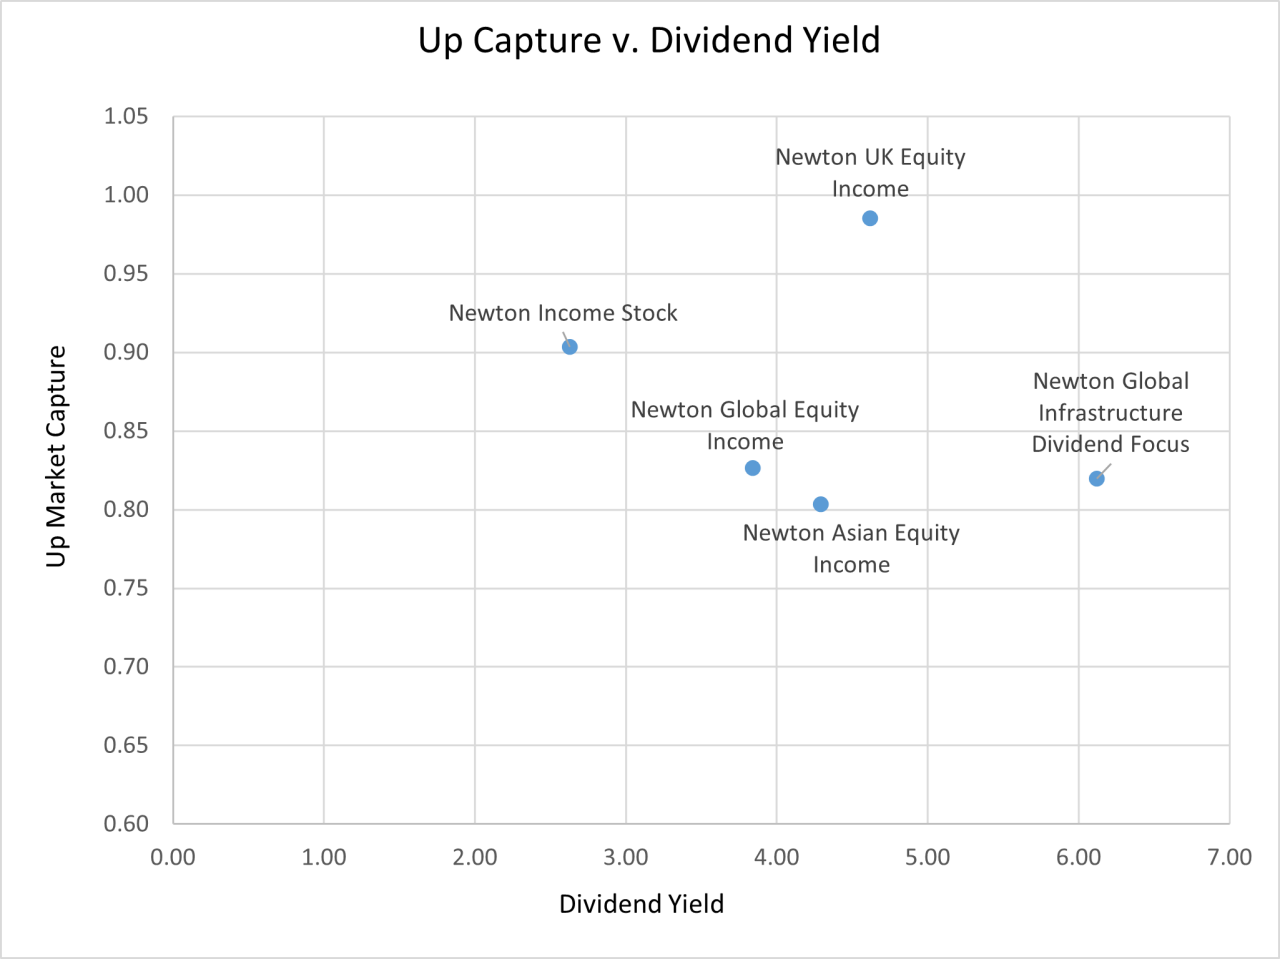
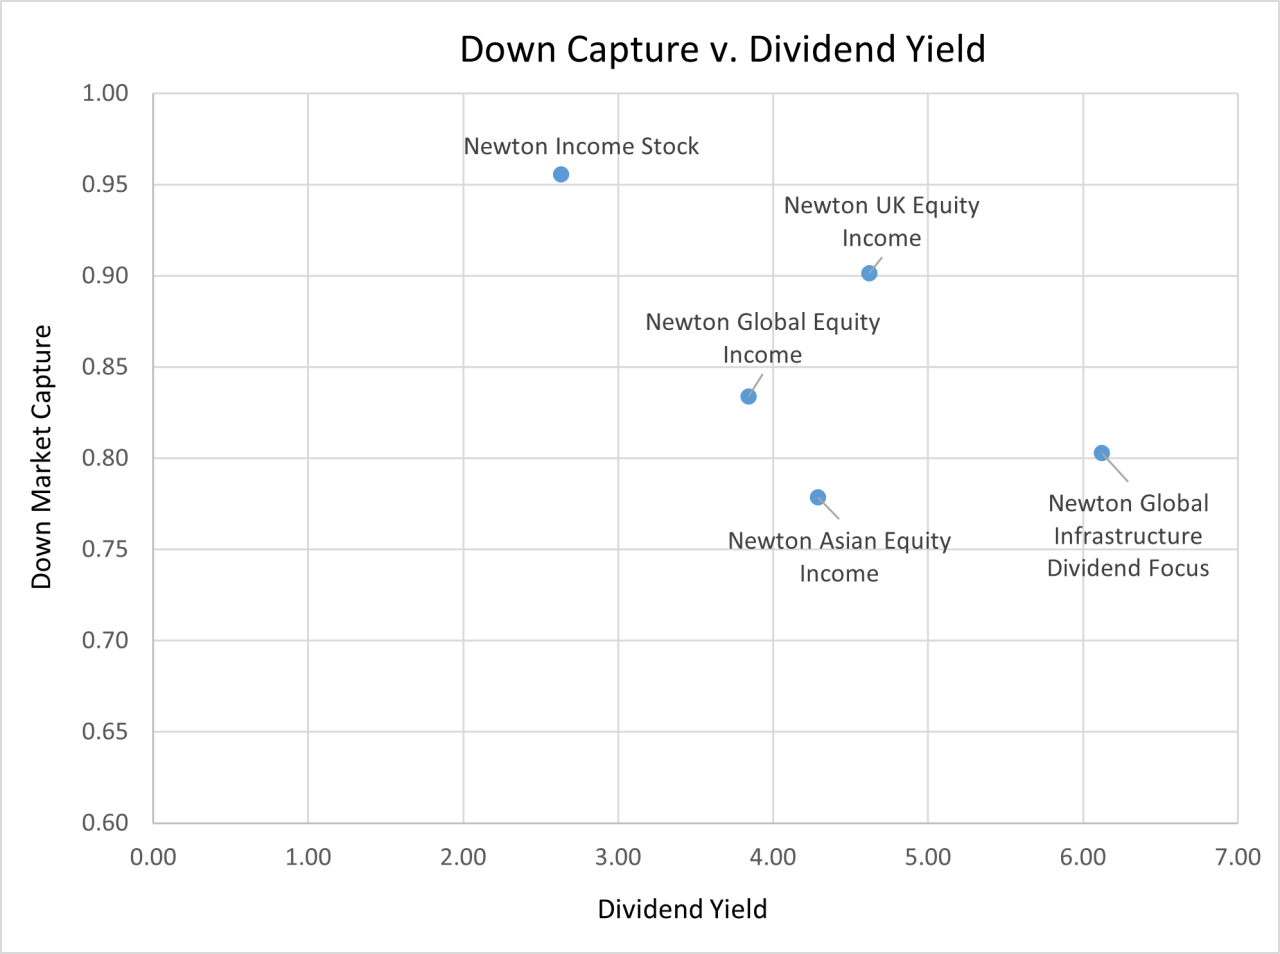
Source: evestment. 10 year data as of 31 December 2023. Performance calculated as a total return gross of fees in USD. Fees and charges apply and can have a material impact on the performance of your investment.
WHY NEWTON INVESTMENT MANAGEMENT
A global multi-specialist investment manager with a full spectrum of research-driven solutions.
Hello
Hello
Newton's suite of income strategies seek to achieve income distributions and long-term capital growth. The philosophy behind the solutions in that the compounding of dividends is the dominant source of long-term real returns.
*Source: Newton. 31 December 2023
1 Excludes UK Equity Income portfolio managers.
2 Years’ investment experience and tenure at firm are team average numbers as at 31 December 2023 with years at firm relating to tenure at Newton and / or Mellon Investment Corporation. Source: Newton group of companies, 31 December 2023
*Newton, 2023
The value of investments can fall. Investors may not get back the amount invested.
| 2023 | 2022 | 2021 | 2020 | 2019 | 2018 | 2017 | |
| Newton Asian Equity Income strategy | 6.95 | 0.84 | 6.95 | 5.95 | 14.81 | 1.27 | 12.89 |
| FTSE Asia Pacific ex-Japan TR | 2.29 | -5.88 | -0.10 | 19.42 | 14.48 | -8.51 | 23.37 |
| Newton Global Equity Income strategy | 5.75 | 8.91 | -15.91 | 3.01 | 22.10 | 0.71 | 8.93 |
| FTSE World | 17.18 | -7.16 | 22.07 | 12.74 | 22.81 | -3.09 | 13.34 |
| Newton Global Infrastructure Dividend Focus Equity strategy | 9.97 | -7.39 | 16.29 | -12.56 | 21.22 | -6.03 | 17.48 |
| S&P Global Infrastructure | 6.79 | -0.17 | 11.87 | -5.76 | 26.99 | -9.50 | 20.13 |
| Newton Multi-Asset Income Strategy | 5.17 | -0.58 | 12.00 | 4.20 | 16.34 | -5.12 | 13.08 |
| Newton Income Stock Strategy | 10.14 | 4.62 | 31.02 | -1.83 | 29.30 | -7.94 | 16.11 |
| S&P 500 | 26.29 | -18.11 | 28.71 | 18.40 | 31.49 | -4.38 | 21.83 |
| Newton UK Equity Income Strategy | 11.38 | 9.69 | 17.62 | -8.57 | 21.15 | -6.41 | 11.68 |
| FTSE All-Share | 7.92 | 0.34 | 18.32 | -9.82 | 19.17 | -9.47 | 13.10 |
Source: Newton, eVestment. Data as at 31 December 2023. Newton Global Equity Income strategy, Newton Asian Equity Income strategy, Newton UK Equity Income strategy and Newton Multi-Asset Income strategy performance calculated as a total return, income reinvested, gross of fees in GBP. Newton Global Infrastructure Dividend Focus Equity strategy and Newton Income Stock performance calculated as a total return, income reinvested, gross of fees in USD. Fees and charges apply and can have a material effect on the performance of your investment.
Past performance is not a guide to future performance. The value of investments can fall. Investors may not get back the amount invested. Income from investments may vary and is not guaranteed.
Please refer to the prospectus and the KIID/KID before making any investment decisions. Documents are available in English and an official language of the jurisdictions in which the Fund is registered for public sale. Go to www.bnymellonim.com.
1825750