Please ensure Javascript is enabled for purposes of website accessibility Short-dated high yield: the importance of excess spread
be
en
intermediary
intermediary
false
true

When looking at high yield investments, excess spreads are a more important metric than market spreads, says the Insight Investment team.

Strategy outlook1

  • Insight2 ’s global short-dated high yield bond strategy entered 2024 with a yield of around 6.3% in euros3 , which we view as attractive. The average bond price was around 95.5 and the average coupon 5.8%.
  • Barring a significant change in outlook, our aim is to generate a single high digit return in 2024. This follows a 12.36% return in 2023, gross of fees and in euros4

Yields have dropped but remain high

After a seismic upward shift in yields over recent years, high yield markets rallied into the end of 2023 (see Figure 1) but yields remained well above the levels seen in recent years. 


A driver has been a normalisation of market spreads, which have tightened to levels seen a few years ago (see Figure 2).


Excess spread is key for high yield 

When looking at high yield investments, excess spreads are a more important metric than market spreads. The excess spread is the market spread, deducting an expected level of defaults.  

In high yield, there is a typically a higher risk of defaults than in investment grade credit. Market spreads can sometimes appear to be very high, but if defaults are also high, the actual return investors can expect to receive is the excess spread. For example, during the pandemic, market spreads rose sharply, but this was a precursor to a steep rise in defaults (see Figure 3).


Default rates have moved upwards over the last year but continue to run at levels close to long-term averages. Many high yield issuers have been able to raise prices, boosting revenues while their funding costs are locked in at low levels. 

Minimising defaults maximises excess spread and returns

Our global short-dated high yield bond strategy has a long-term track record in avoiding defaults (see Figure 4), primarily as we seek to invest in instruments which mature in two years or less, and we rigorously screen credits with a bottom-up credit analysis process which focuses on cash generation.

The strategy loss rate from defaults is running at approximately 12bp per annum since 2016.


Targeting zero defaults

When we analyse companies, our aim is to accurately forecast cashflows for the companies we invest in over our two-year investment horizon. If a company reports a deviation from our expectation, we seek to sell the position. This provides us with confidence that over time our defaults should be close to zero.

At Insight we classify a default as when the price of an issue declines by 50 points, rather than when an actual default occurs. There have been only three occasions since 2011 where Insight’s global short-dated high yield bond strategy has sold bonds at a price of 50 or below, but these were always during times of extreme market stress, including the oil price crash in 2014, and during the pandemic and subsequent lockdowns in 2020. 

Given our approach to avoiding defaults, we would expect Insight’s global short-dated high yield bond strategy to have a level of defaults well below the market in aggregate.

Fully benefiting from high yields

At a 6.3%  yield in euros, the strategy had a market spread of 445bp at end 2023. If we achieve our zero-default target, our market spread and excess spread will be the same. In effect,  this means the excess spread of the strategy is around 140bp  above the excess spread of the euro high yield market in aggregate (see Figure 5).


Conclusion

Although market spreads may demonstrate volatility, this is often reflective of changing perceptions about the future level of defaults. In our view, our proven track record of avoiding the large majority of defaults means our investors have been able to benefit more fully from the yield premium available in high yield credit than those investors taking a more traditional approach to the asset class.

Although market spreads (being made up of compensation for expected defaults and excess spread) have rallied, the consensus amongst forecasters is that defaults will not rise materially over the next few years. In our view, the absolute level of yields and the excess spread available in the strategy, given our approach to avoiding defaults, is extremely attractive.


Key investment risks

Objective/Performance Risk: There is no guarantee that the Strategy will achieve its objectives.

Currency Risk: This Strategy invests in international markets which means it is exposed to changes in currency rates which could affect the value of the portfolio.

Derivatives Risk: Derivatives are highly sensitive to changes in the value of the asset from which their value is derived. A small movement in the value of the underlying asset can cause a large movement in the value of the derivative. This can increase the sizes of losses and gains, causing the value of your investment to fluctuate. When using derivatives, the Strategy can lose significantly more than the amount it has invested in derivatives.

Changes in Interest Rates & Inflation Risk: Investments in bonds/money market securities are affected by interest rates and inflation trends which may negatively affect the value of the portfolio.

Credit Ratings and Unrated Securities Risk: Bonds with a low credit rating or unrated bonds have a greater risk of default. These investments may negatively affect the value of the portfolio.

Credit Risk: The issuer of a security held by the Strategy may not pay income or repay capital to the portfolio when due.

Emerging Markets Risk: Emerging Markets have additional risks due to less-developed market practices.

Liquidity Risk: The Strategy may not always find another party willing to purchase an asset that it wants to sell which could impact the Strategy’s ability to sell the asset or to sell the asset at its current value.

Counterparty Risk: The insolvency of any institutions providing services such as custody of assets or acting as a counterparty to derivatives or other contractual arrangements, may expose the Strategy to financial loss.

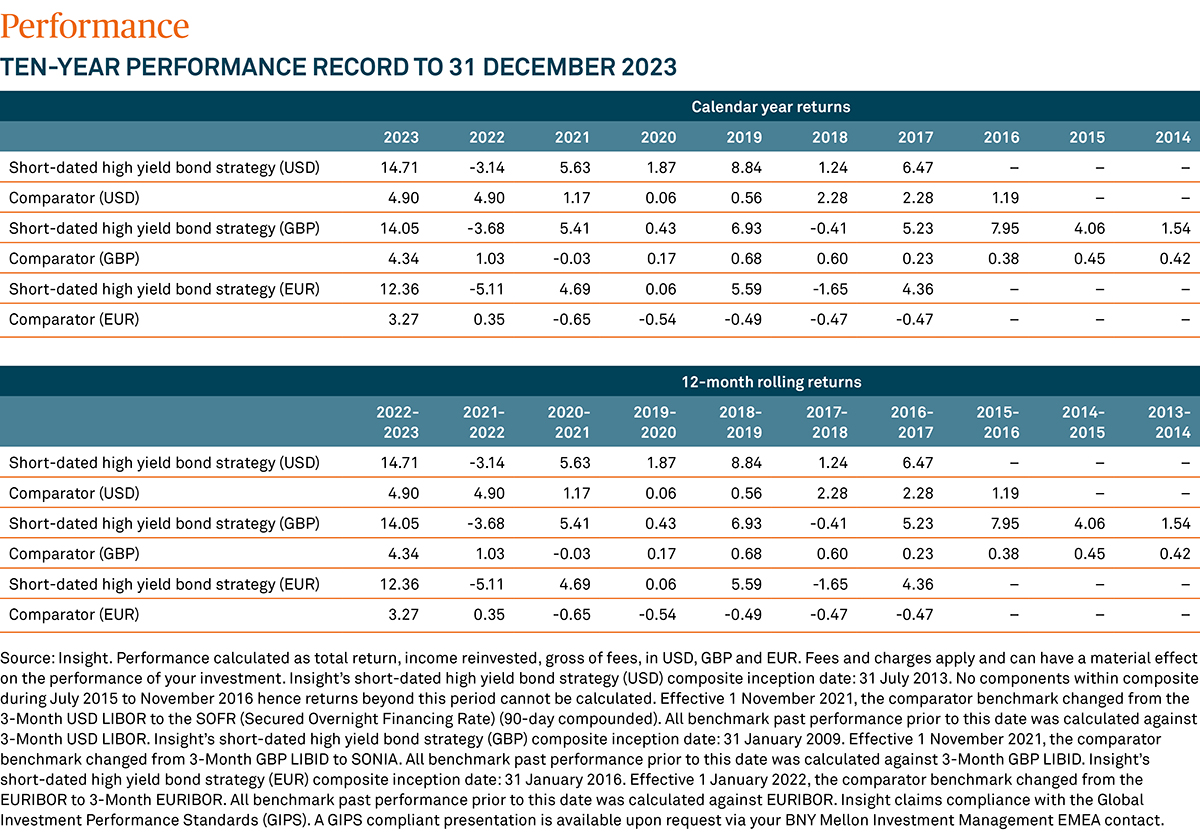
Past performance is not a guide to future performance.

The value of investments can fall. Investors may not get back the amount  invested. Income from investments may vary and is not guaranteed.

This article was written by Insight Investment. As such, it is in its voice as opposed to that of BNY Mellon Investment Management.

1 Source: Insight. Data as at 31 December 2023. See performance data and disclaimers as the end of this article
2  Investment Managers are appointed by BNY Mellon Investment Management EMEA Limited (BNYMIM EMEA), BNY Mellon Fund Managers Limited (BNYMFM), BNY Mellon Fund Management (Luxembourg) S.A. (BNY MFML) or affiliated fund operating companies to undertake portfolio management activities in relation to contracts for products and services entered into by clients with BNYMIM EMEA, BNY MFML or the BNY Mellon funds.
3 The yield is the effective rate of interest paid on a bond. It is shown as a weighted average of the yield of the investments in the strategy. The yield is inversely related to the price of the bond and is expressed as a percentage based on cost and current market value
4 Performance calculated as total return, income reinvested, gross of fees, in EUR.  Fees and charges apply and can have a material effect on the performance of your investment. Insight claims compliance with the Global Investment Performance Standards (GIPS).  A GIPS compliant presentation is available upon request via your BNY Mellon Investment Management EMEA contact.
5 Source: Insight and Bloomberg. ICE Bank of America US, Euro High Yield and Global High Yield Indices. Yield to worst. Data as at 31 Dec 2023.
6 Source: Insight and Bloomberg. ICE Bank of America US and Euro High Yield Indices spread vs government. Data as at 31 Dec 2023
7 Source: Insight. Shows spread of ICE Bank of America US High Yield Index vs high yield default rates compiled by JP Morgan. A default in this context is classed as when an issuer fails to fulfil the payment debt obligation. Data as at 31 Dec 2023.
8 Source: Moody’s and Insight as at 30 October 2023. The global high yield universe constitutes of global issuers rated by Moody’s based on their rating at the beginning of the year.
9 Source: Insight and Bloomberg. Data compiled & sourced by JP Morgan, assumes 150bp loss rate in 2023. As at 31 December 2023.
1733750 Exp: 30 April 2024

This is a marketing communication